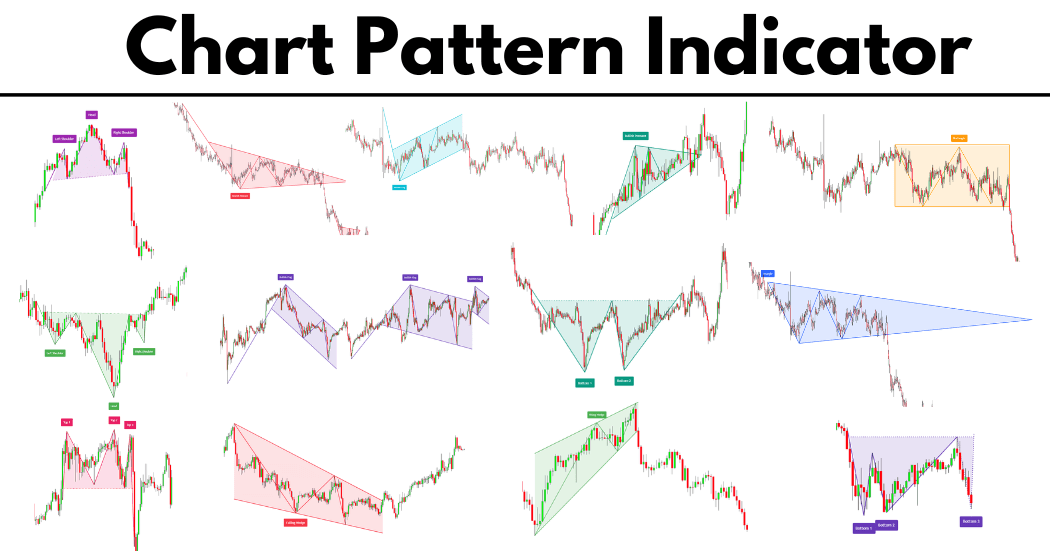
CHART PATTERNS
What is Support and Resistance?
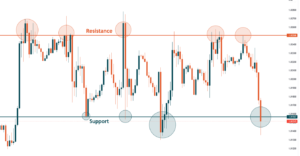
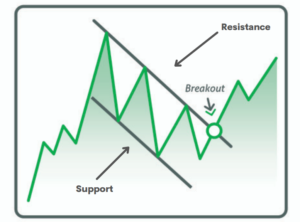
The essential price points of support and resistance are where supply and demand determine significance levels.
- Resistance may turn into support once the price breaks through it.
- The strength of a region of resistance or support increases with the frequency with which price tests it without breaking through.
- Traders can take either a long position, meaning go bullish, or a short post, meaning bearish.
What is Support and Resistance?
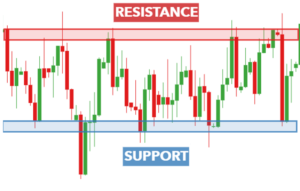
How to draw them?
Support and resistance lines need at least two price points to be drawn. Connect two swing highs or two swing lows in a price chart with a trendline and project the trendline into the future.
Trade the “Break”
- Buy when the price falls towards support.
- Sell when the price rises towards resistance.
Trade the “Bounce”
- When the price breaks above resistance, buy.
- When the price breaches support, it is time to sell.
BULLISH CHART PATTERNS
1. Flag ( Pattern Type: Continuation )
- The Flag Pattern forms in a time of consolidation.
- The flag’s rectangular shape develops from parallel trendlines, which serve as the price’s initial support and resistance levels.
- A breakout occurs from the flag in the same direction as the initial move. This pattern can be viewed on larger time frames, like daily and weekly.
- Traders will typically enter a long position after the breakout and an increase in volume.
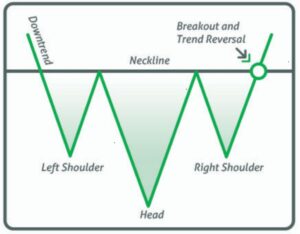
2. Inverse Head & Shoulder ( Pattern Type: Continuation )
- As the price hits lows below the neckline, a trough is formed. Until it creates three channels or low points: the left shoulder, the head, which is the lowest, and the right shoulder.
- An Inverse Head and shoulder pattern can be viewed on larger time frames, like weekly and monthly.
- Traders typically enter a long position once the price breaks above the neckline’s resistance.
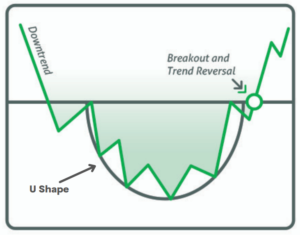
3. Rounding Bottom ( Pattern Type: Continuation )
- In charting terminology, a rounding bottom is a pattern that visually represents the letter “U.”
- This trend is similar to the chart of the cup and handle but without the downtrend handle.
- A Rounding Bottom pattern can be viewed on larger time frames, like hourly and daily.
- Traders will feel safe buying at the breakout, Which is also the starting of a bullish trend.
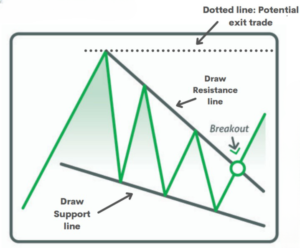
4. Falling Wedge ( Pattern Type: Continuation & Reversal )
- This Pattern starts more comprehensively at the top and narrows as it moves down—the wedge pattern results in causing the price to increase.
- A Falling Wedge pattern can be viewed on larger time frames, like hourly and daily.
- Many buyers will show up, and volume should increase as the price breaks.
- Traders will look for buying opportunities at the breakout and potentially exit at the start of the Pattern.
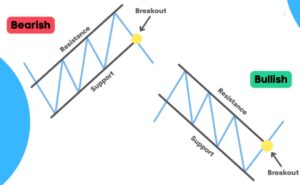
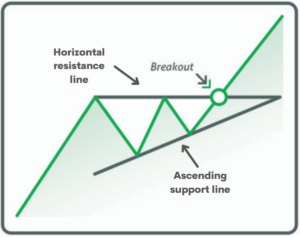
5. Ascending Trinagle ( Pattern Type: Continuation )
This Ascending Triangle pattern is a bullish continuation pattern, which means that a breakout is likely.
- You must place a horizontal line over the resistance points to draw this pattern.
- Then, draw an ascending line along with the support points. This pattern can be used in any time frame, even minutes.
- Traders will look for a breakout with volume, and in some cases, the price will come, retest the breakout level, and then continue the uptrend.
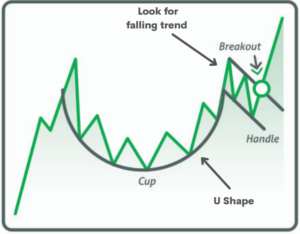
6. Cup and Handle ( Pattern Type: Continuation )
The Cup with Handle Pattern resembles the shape of a cup and a handle. It is an arched pattern that can be identified by its u-shape, followed by the handle having a slight downward drift.
- Ultimately, the pattern becomes bullish, completing the ‘handle.’
- The rounding bottom design looks the same but without the handle formation.
- Traders will wait for the falling handle to form and enter at the breakout.
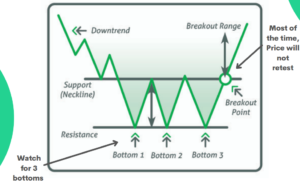
7. Triple Bottom ( Pattern Type: Reversal )
- Most people describe a triple bottom as three fairly equal lows rebounding off one another. the support line.
- Later, it is followed by a breakout point, Which is the best opportunity to enter a bullish position.
- After the breakout point, the price usually does not retest the neckline.
- Traders will enter into a long place after the breakout point. A triple Bottom pattern can be viewed on larger time frames, like hourly and daily.
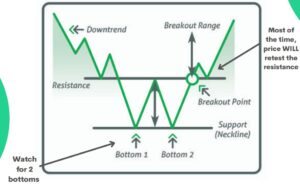
8. Double Bottom ( Pattern Type: Reversal )
The pattern indicates a reversal in the overall trend. Double Bottom resembles the look of a “W.’ The price will drop two times and bounce off the support line, eventually breaking out.
- In this case, the price will retest the breakout point, unlike the Triple Bottom pattern.
- Double Bottom pattern can be viewed on larger time frames, like hourly and daily.
- Traders will look for a breakout BUT will wait for a retest and bounce of the resistance line.
BEARISH CHART PATTERNS
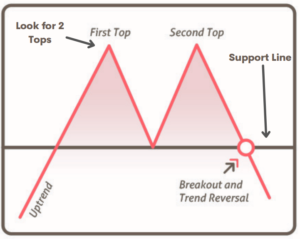
1. Double Top ( Pattern Type: Reversal )
- Double Top is a bearish pattern after the price has peaked two times.
- And the trend has reversed when the price breaks support, completing an “M” shape.
- This results in an increase in selling volume. Double Top patterns can be viewed on larger time frames, like hourly and daily.
- Traders will sell when the price breaks below the support line or sometimes take short positions to make profits.
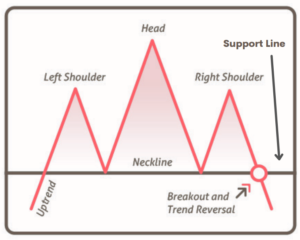
2. Head & Shoulder ( Pattern Type: Reversal )
- A head and shoulder appear as a baseline with three peaks, the largest in the middle and the other two near the same height.
- This pattern is looked at on a daily or, in some cases, on an hourly time frame.
- Remember that the Head and shoulder pattern is never in perfect formation.
- Traders will look for a break below the neckline to go short on a position.
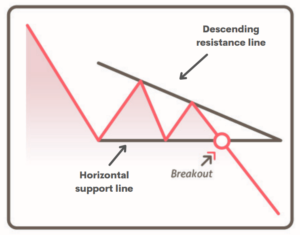
3. Descending Triangle ( Pattern Type: Continuation )
- A descending Triangle is a well-known bearish pattern; the support line is horizontal, and the resistance line is descending alongside.
- Breaking through the resistance level will cause the price action to fall.
- This pattern can be used in any time frame, even minutes.
- Traders will look for a break below the horizontal support line to take a short position.
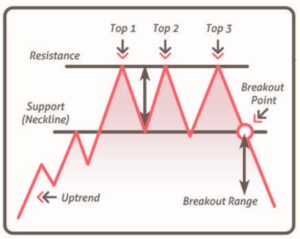
4. Triple Top ( Pattern Type: Reversal )
- A triple-top pattern occurs when the price creates three peaks at the same price level.
- This reversal pattern represents buying weakness and results in a sell-off.
- Triple Top design can be viewed on larger time frames, like hourly and daily.
- Traders will look to enter a short position or exit a long post once the price breaks below support (neckline).
BILATERAL CHART PATTERNS
These chart patterns can move in either the Bullish or Bearish direction.
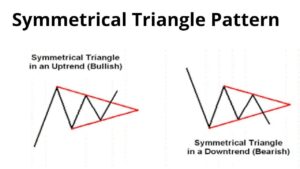
1. Symmetric Trinagles ( Pattern Type: Reversal or Continuation)
- This Pattern includes a triangle, similar to an angle bracket ( > ) used in mathematics.
- The trend lines start to meet and get squeezed at the end, which means a bullish or bearish trend is possible.
- The Symmetrical Triangle might last for a short or a long time.
- Traders will look for a breakout or a break below and take either a long or short position.
2. Price Channels ( Pattern Type: Reversal or Continuation)
Price An upper and lower trend line encircles the channel, which can slope either up or down. Support and resistance are marked by the upper and lower trend lines, respectively.
- Price stays in between this support and resistance levels until it is broken out.
- The price will occasionally retest the breakout point.
- Traders can sell when the price approaches the price channel’s upper trendline and buy when it tests the lower trendline.