Blog

Understand Market Balance-Imbalance in Forex

The Forex market follows a simple pattern of balance, imbalance, imbalance, etc. Until it trades above the high excess (breakout above the resistance level) or below the low excess (breakout below the support level), the market oscillates between the established excesses. Balance Area: As the accompanying chart illustrates, there should be an equal amount of […]

Read More

Introduction to Supply and Demand Advance

What is Supply and Demand? The supply and demand concept posits that an excess of a commodity is produced when the supply is high, and the demand is low, resulting in a decrease in its price. Scarcity is caused by a low supply of a commodity and a high demand, which in turn drives the […]

Read More

What are Supply and Demand?

In the next lessons, you will be able to learn how to trade Set and Forget’s supply and demand methodology. The well-known forces of capitalism rule the markets the same way the law of gravity governs our planet. Buyers and sellers are in a constant and never-ending battle. The only reason why price moves in […]

Read More

The Trend Reversal Trading Strategy Guide

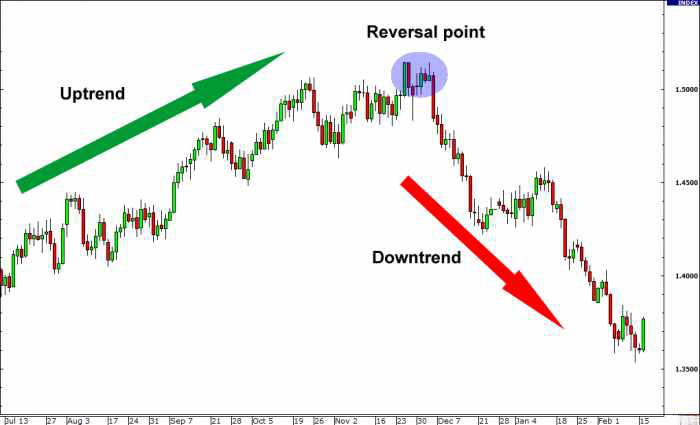
Do you make these mistakes in reversal trading? Here’s the thing: Trading trends can be a successful strategy for trading the markets. There are right and wrong ways to use this trading method, just as with any other. Let me first explain how you SHOULD NOT do it before I show you how to do […]

Read More

CHART PATTERNS

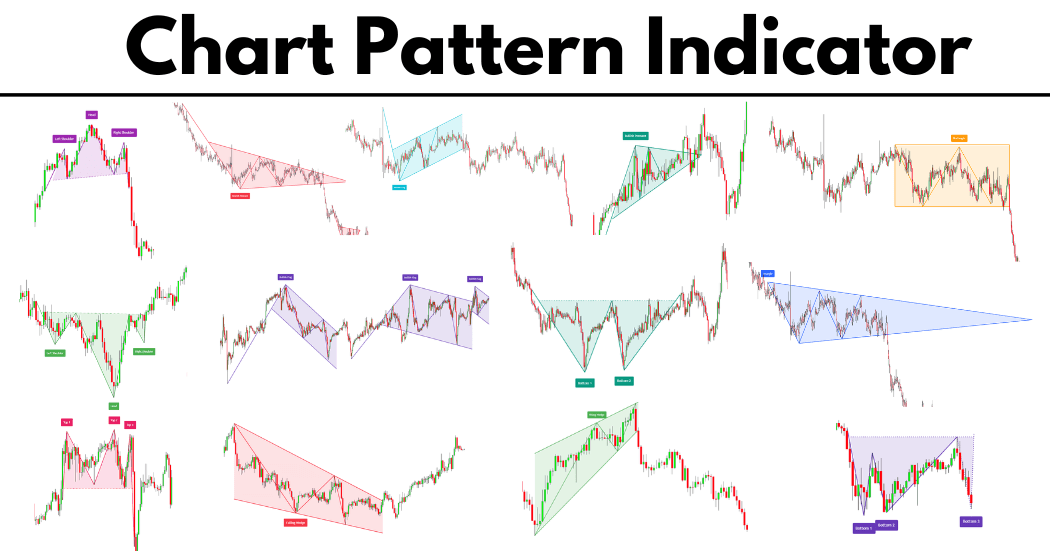
What is Support and Resistance? The essential price points of support and resistance are where supply and demand determine significance levels. Resistance may turn into support once the price breaks through it. The strength of a region of resistance or support increases with the frequency with which price tests it without breaking through. Traders can […]

Read More

GRAPHIC INDICATORS

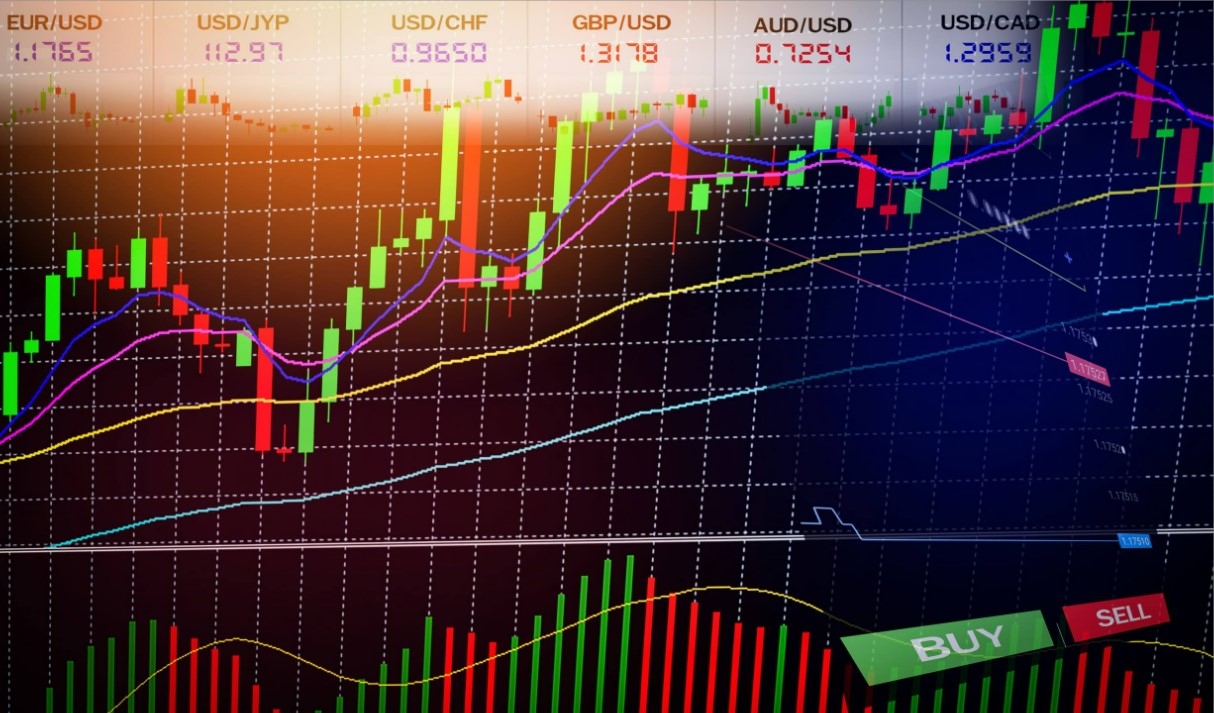
What are Technical Indicators? Trading indicators are calculations that are displayed as lines on a price chart and can be used by traders to spot specific market signals and trends. Examples of the leading and lagging indicators are several categories of trading indicators. A forecast signal that foretells future price fluctuations is known as a […]

Read More

CANDLE STICK PATTERNS

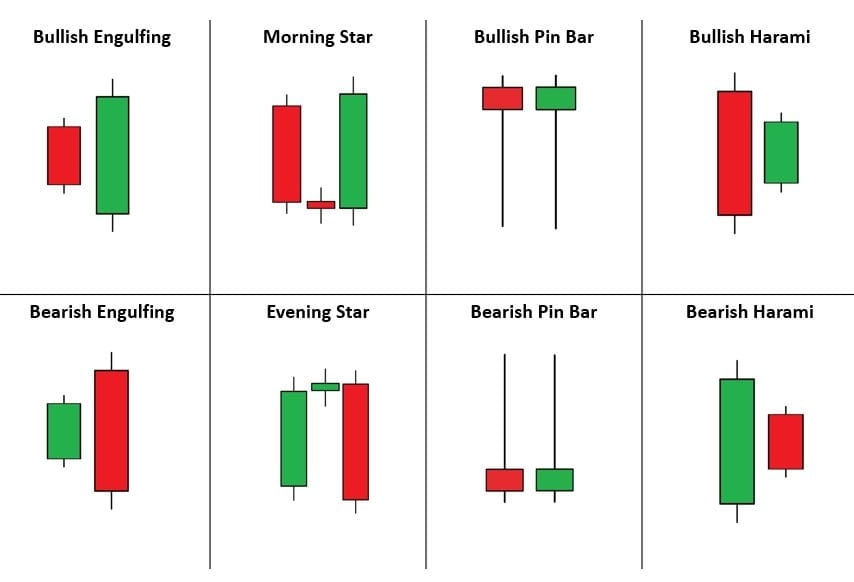
What is a Candle Stick? On a candlestick price chart, a candlestick is a single bar that displays a trader’s market movements at a glance. Each candlestick shows a market’s open price, low price, high price, and close price for a particular time. The body represents the open-to-close range. The wick, or shadow, indicates the […]

Read More
Rules Of Forex Trading Discipline

15 Rules Of Forex Trading Discipline

The ideal loss is the first one. It is best to get out of your deal as soon as you discover it is bad. It’s never a loser until you go out, and traders in the pit frequently quip, “Don’t worry, it comes back.” When the phrase is used, it is an affirmation that the […]

Read More

10 Forex Trading Discipline Rules

1. The market rewards discipline. Trading with discipline will increase your profits and decrease your losses. The one thing always true about the markets is that discipline leads to higher earnings.   2. Trade consistently with discipline, and the market will reward you. However, IF YOU ARE NOT 100% OF THE TIME DISCIPLINED, DO NOT […]

Read More