GRAPHIC INDICATORS
What are Technical Indicators?
Trading indicators are calculations that are displayed as lines on a price chart and can be used by traders to spot specific market signals and trends.
- Examples of the leading and lagging indicators are several categories of trading indicators.
- A forecast signal that foretells future price fluctuations is known as a leading indicator.
- The lagging Indicator looks at the past trends and indicates momentum.
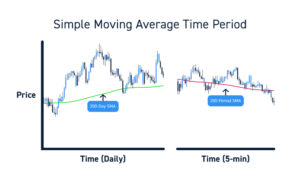
1.Simple Moving Average (SMA)
- It is simply the average price over the specified period. And should be used on the DAILY timeframe.
- To get a 50-period SMA, for example, add up all the price closings over the last 50 days and then divide by 50.
- Simple moving averages of 10, 50, and 200 days are frequently used as default indicators.
- SMAs are frequently used to identify if a trend is bullish or bearish.
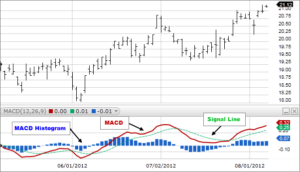
2. Moving Average Convergence Divergence (MACD)
- This technical indicator of momentum uses moving averages to determine a trend’s strength.
- MACD crossing above zero is considered bullish while crossing below zero is bearish.
- Also, the indicator is considered bullish when the MACD line crosses from below to above the signal line.
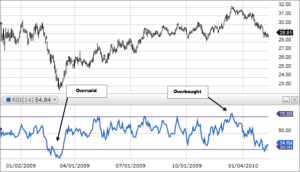
3. Relative Strength Index (RSI)
- The RSI fluctuates between zero and 100, and a momentum oscillator measures the velocity and variance of price movements.
- When the RSI crosses 70, it is generally considered overbought; when it crosses 30 or below, it is considered oversold.
- Similar to the MACD, RSI is also used to confirm price action.
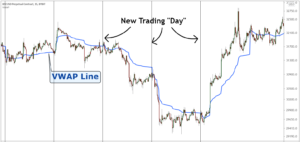
4. Volume-Weighted Average Price (VWAP)
- A trading benchmark called VWAP provides the average Price. It traded throughout the day based on volume and Price.
- It is also used for support, resistance, entry, and exit levels.
- Volume-weighted average Price is only used on the intraday time frame.
- VWAP might be as easy as purchasing an entrance at the first closing price above VWAP and selling it at a fixed price above it.
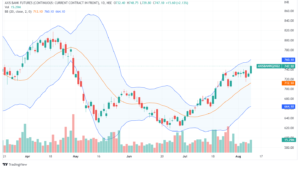
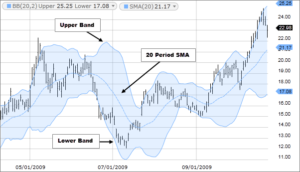
5. Bollinger Bands
- Three lines comprise a Bollinger Band: the middle band, a simple moving average, and the upper and lower bands.
- The bands are dynamic/sensitive to changes in volatility. When the bands widen, price volatility increases; when the band contracts, volatility decreases.
- A Bollinger Band comprises three lines: the upper and lower bands, the center band, and a simple moving average.
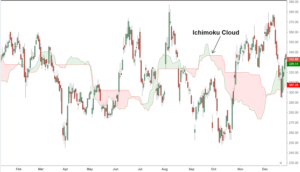
6. Ichimoku Cloud
- Technical indicators that display momentum and support and resistance levels are gathered under the Ichimoku Cloud—& trend direction. When the price is below the cloud, consider bearish.
- When the price is above the cloud, consider bullish.
- The lines include a 9-period average, a lagging closing price line, a 26-period average, an average of those two averages, and a 52-period average.
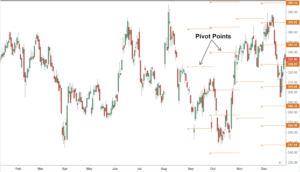
7. Pivot Points
- They’re calculated based on previous trading sessions’ high, low, and closing prices.
- Pivot Points predict support and resistance levels in the current or upcoming session.
- This indicator automatically graphs 7 Pivot Point levels: R1, R2, R3, S1, S2, S3, and P.