CANDLE STICK PATTERNS
What is a Candle Stick?
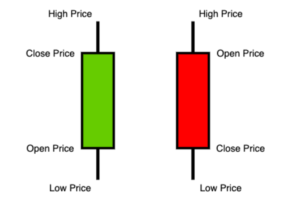
On a candlestick price chart, a candlestick is a single bar that displays a trader’s market movements at a glance. Each candlestick shows a market’s open price, low price, high price, and close price for a particular time.
- The body represents the open-to-close range.
- The wick, or shadow, indicates the peak and trough of the day.
- The hue indicates which way the market is moving – a green body indicates a price increase, while a red body shows a price decrease.
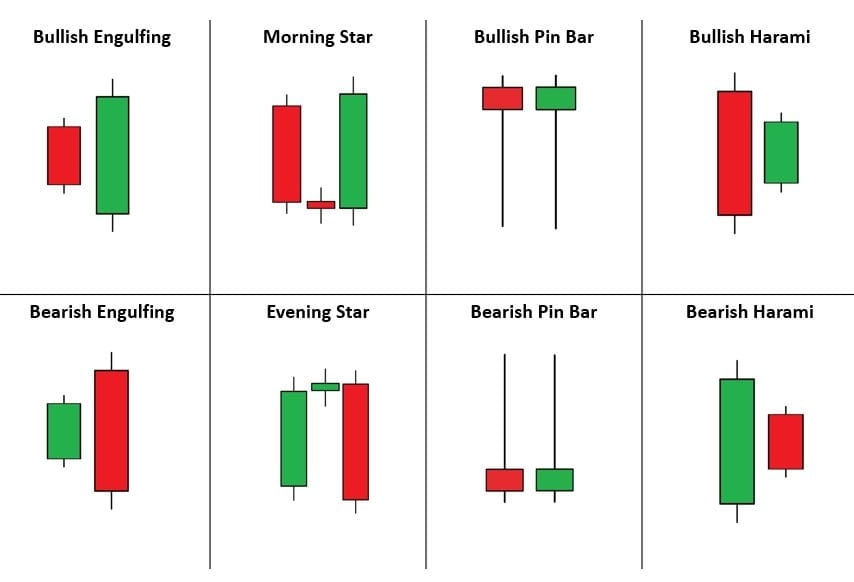
BULLISH CANDLE – STICK PATTERNS
1. Hammer
- The hammer candlestick pattern consists of a small body and a long wick extending from the bottom.
- This pattern can be seen at the support line of a downward trend (see example below). Hammer candlesticks typically occur after a price decline.
- Hammer candlesticks indicate a potential price reversal to the upside. The price must start moving up following the hammer; this is called confirmation.
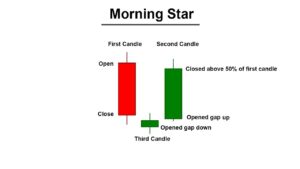
2. Morning Star
- This is a three-stick pattern: one short-bodied candle between a long red and a long green candle.
- The morning star’s middle candle depicts a pause in the market where bulls start to overtake bears.
- An upswing may be indicated by the third candle, which validates the reversal.
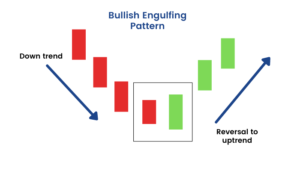
3. Bullish Engulfing
- The pattern of bullish engulfing is composed of two candlesticks. A larger green candle entirely engulfs the first candle, which is a short red body.
- The buying pressure increases, leading to a reversal of the downtrend.
- The second Bullish candlestick is engulfing the body of the first bearish candle stick.
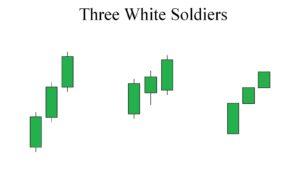
4. Three White Soldiers
- This pattern is made up of three long green candles in a row, this pattern also has to open and close higher than the previous period.
- Three White Soldiers is a strong bullish signal that shows up after a downtrend.
- This pattern is considered a credible reversal pattern when corroborated by additional technical indicators like the relative strength index (RSI).
BEARISH CANDLE – STICK PATTERNS
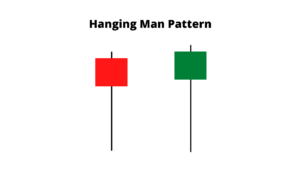
1. Hanging Man
- The hanging man candle has a slight natural body (distance between open and close) and a long lower shadow. There is little to no upper shadow.
- It shows up at the end of an uptrend, indicating that bears are stepping in.
- Extensive selling pressure was present during a part of the candle stick, which created a wick.
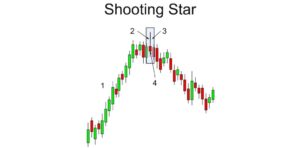
2. Shooting Star
- An inverted hammer is the antithesis of the shooting star. It comprises a red candle with a lengthy upper shadow and a short body.
- The market will often open slightly higher on the candlestick and close slightly below the open.
- A shooting star formation might have been a false indicator if the price increases afterward.
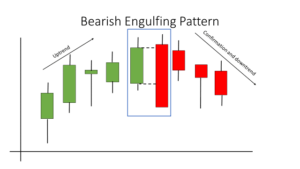
3. Bearish Engulfing
- A bearish engulfing pattern signals the conclusion of an upswing. What counts is the candlesticks’ “real body” or the difference between the open and closing prices.
- The down candle’s actual body must engulf the up candle.
- Anywhere might have a bearish engulfing pattern, including an uptrend or a pullback to the upside with a more substantial downturn.
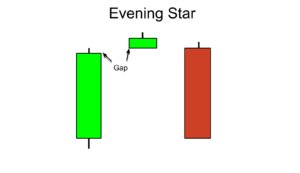
4. Evening Star
- The evening star is a three-candlestick pattern equivalent to the bullish morning star.
- It comprises a short candle sandwiched between a long green candle and a large red candlestick.
- Although this candle stick pattern is uncommon, traders regard the evening star pattern as a trustworthy technical indication.
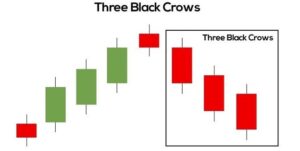
5. Three Black Crows
- The pricing charts show three bearish long-bodied candlesticks with short or no wicks.
- Every session begins at a price comparable to the last, but With every close, selling pressure drives the price down even further.
- Traders use it alongside other technical indicators, such as the relative strength index (RSI).
- The opposite pattern of three black crows is three white soldiers, which indicates a Bullish trend.
BILATERAL CANDLE – STICK PATTERNS
These candle-stick patterns can move in either direction.
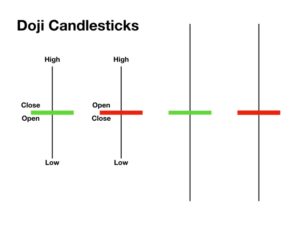
1. Doji
- Doji candlestick has an open and close that are virtually equal.
- It is crucial to stress that the Doji pattern denotes indecision rather than reversal.
- The market explores its upward and downward options, but cannot commit either way.
2. Spinning Top
- The candlestick pattern known as a spinning top features a short actual body centered vertically between the lengthy upper and lower wicks.
- Since buyers and sellers pushed the price but couldn’t maintain it, the pattern signals hesitation and that further sideways movement could follow.
- This candle stick pattern is much more robust in a trending market, whether uptrend or downtrend.
